
Almost all weather forecasting systems combine analytical models and numerical methods to forecast future. In this work, I try to propose a new data driven and scalable method to model atmospheric processes to forecast weather.
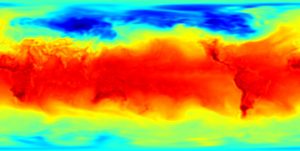
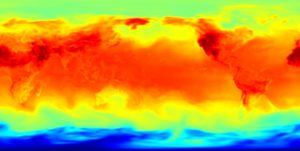
I use a huge dataset of grib (GRIded Binary) files recorded from 1999 until now as input to model construction framework. They are downloaded from NCEP (National Centers for Environmental Prediction). Each file describes the present weather condition of the whole world as 2D grid. Every cell correspond to 1×1 (longitude*latitude) region and describe by about 240 to 350 parameters. Following files are extracted from this dataset and animate the evolution of temperature between 01/01/2000 to 20/01/2000 and 01/07/2000 to 20/07/2000.
1) Evolution of temperature between 01/01/2000 to 20/01/2000
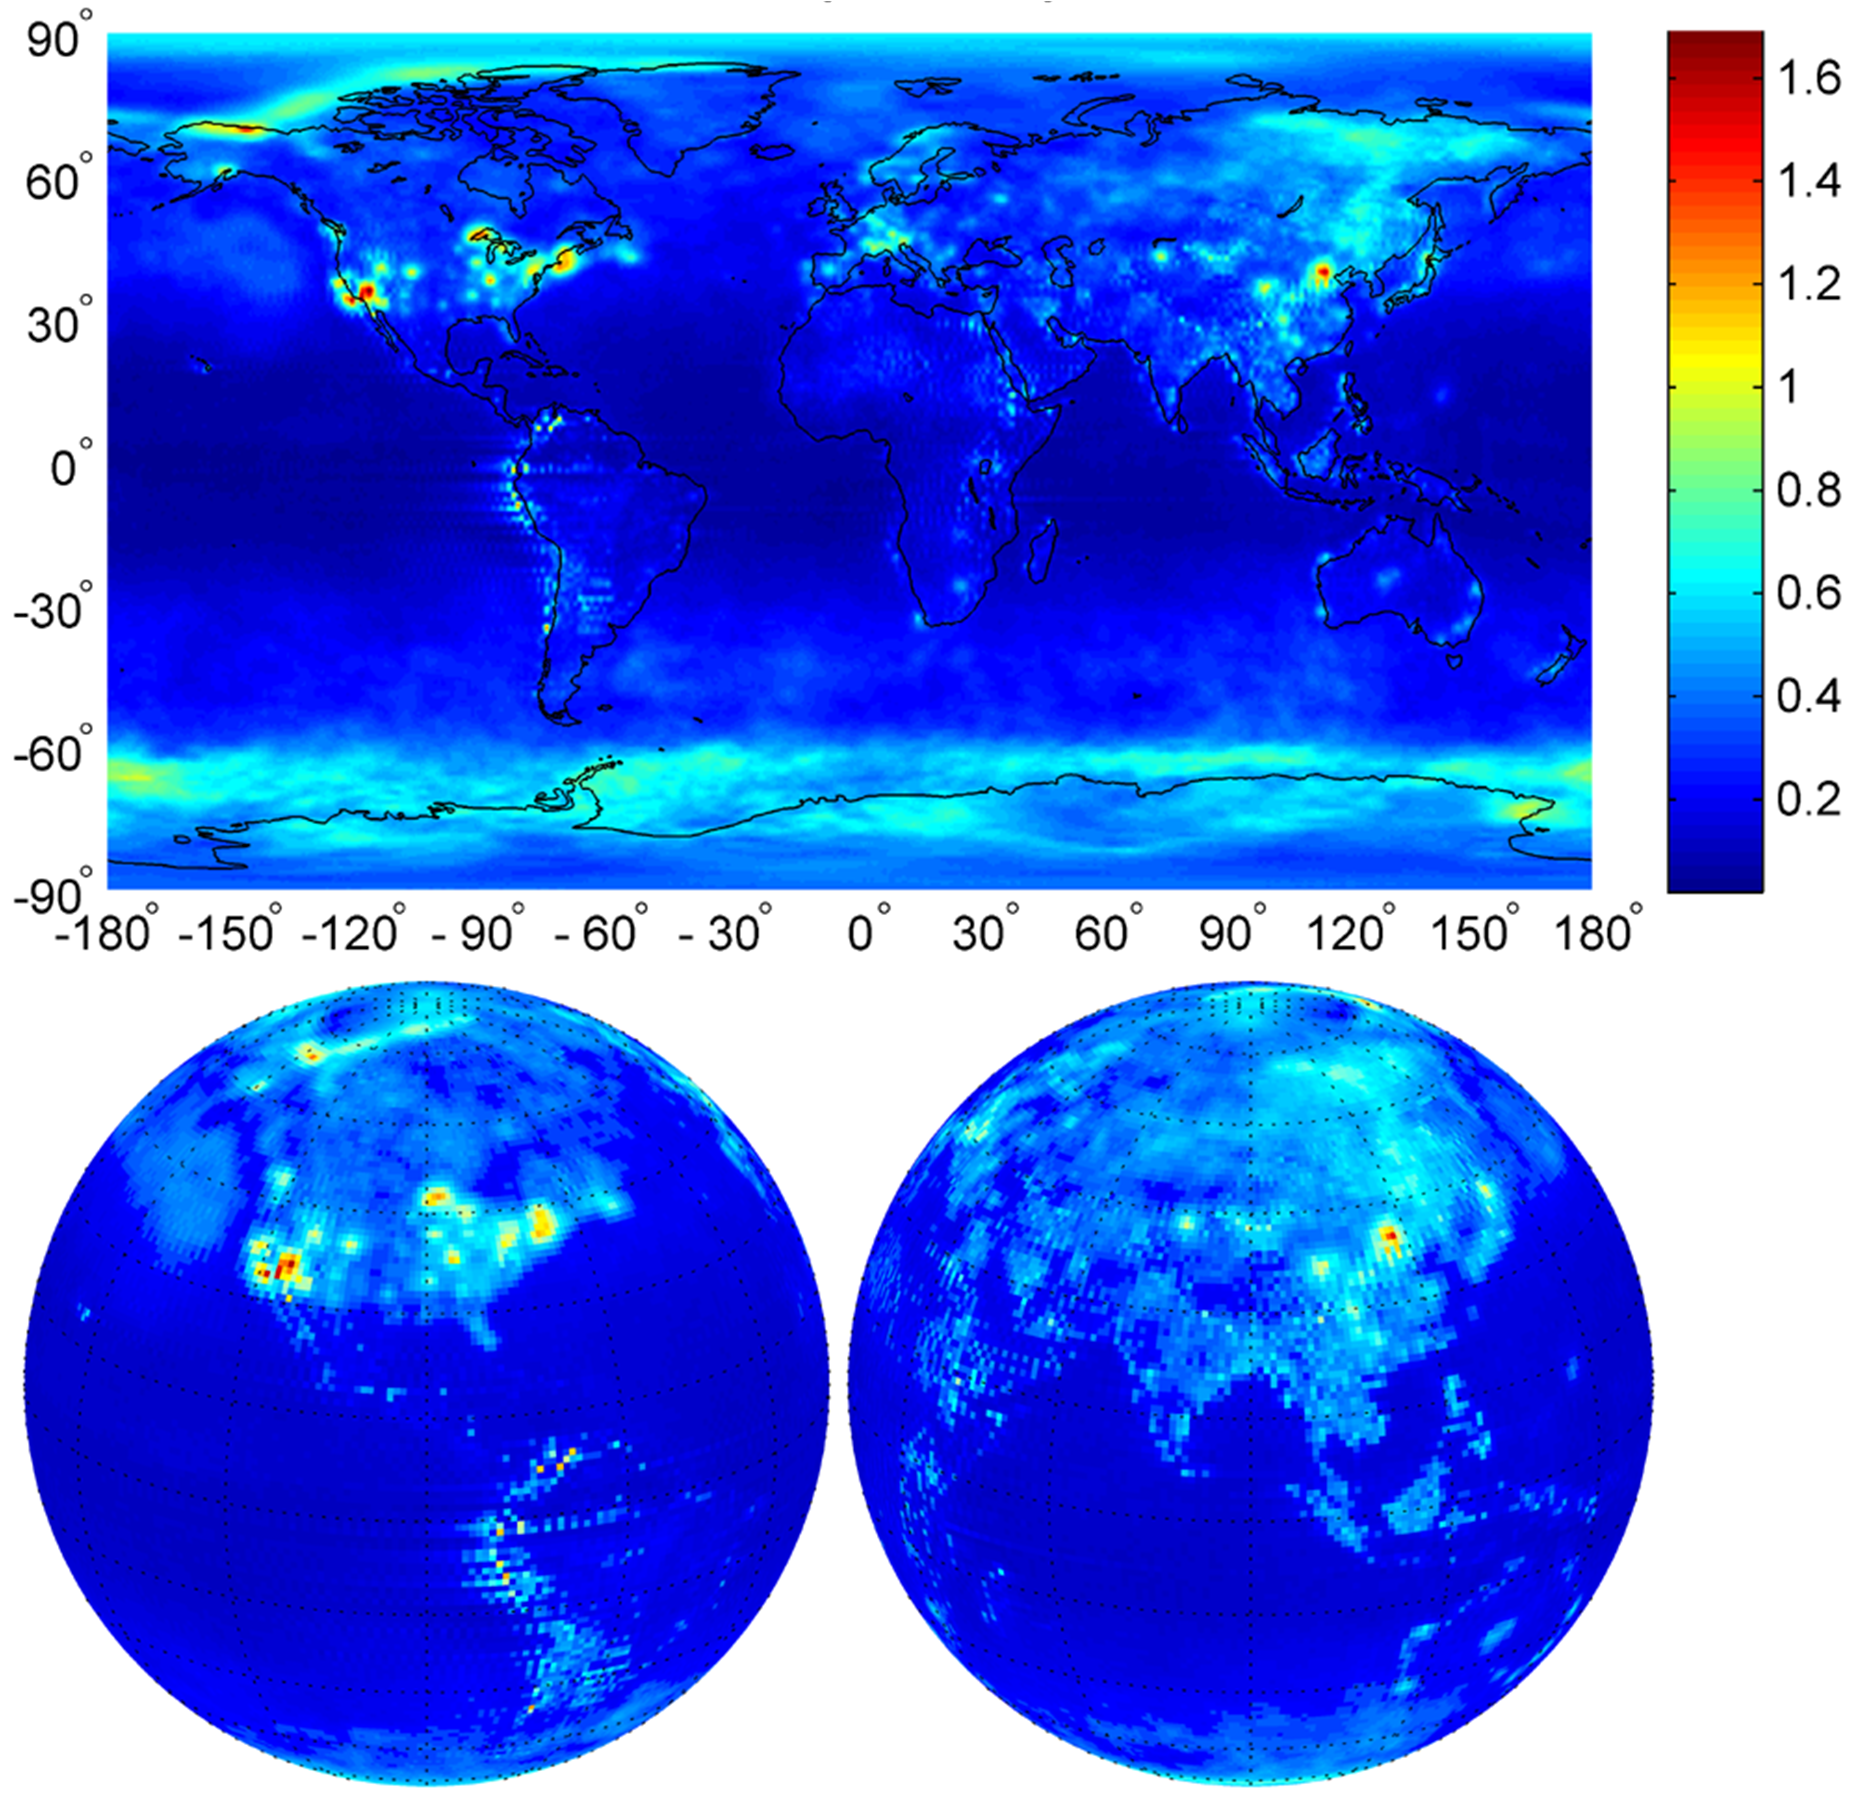
Error map of the GFS system for the surface temperature field. In all pictures, i.e. the planar map and both spheres, pixels with hot colors are related to high error cells and those with cold colors are related to low error cells. Note that the sphere on the left side shows American continent and the one on the right shows asian continent. ——————————————————————————– “Reprinted from Intelligent Data Analysis – An International Journal, Vol 21, Mohsen Moshki, Peyman Kabiri, Alireza Mohebol-Hojeh, Scalable Data-Driven Modelling of Spatio-Temporal Systems: Weather Forecasting, Pages 577-595, Copyright (2017), with permission from IOS Press”.
The publication is available at IOS Press through http://dx.doi.org/10.3233/IDA-150494